


My go-to in-season KenPom feature is the ability to sort by teams’ ratings on specific dates. Using FanMatch, we can assess how much teams have moved up or down within a specific date range.
Below are the 20 teams with the highest ratings bumps and declines after opening night (sorted by adjEM margin gained or lost). You’ll note that in many instances, the rise or decline was simply being on the right side of the 3PT variance machine on opening night. As teams accumulate a couple of games’ worth of data, I’ll start tracking whether their 3PT shooting is “real” or “fake” using ShotQuality’s metrics. Eventually, over a large enough sample, everyone will regress (positively or negatively) towards the national average of around 34.5%.
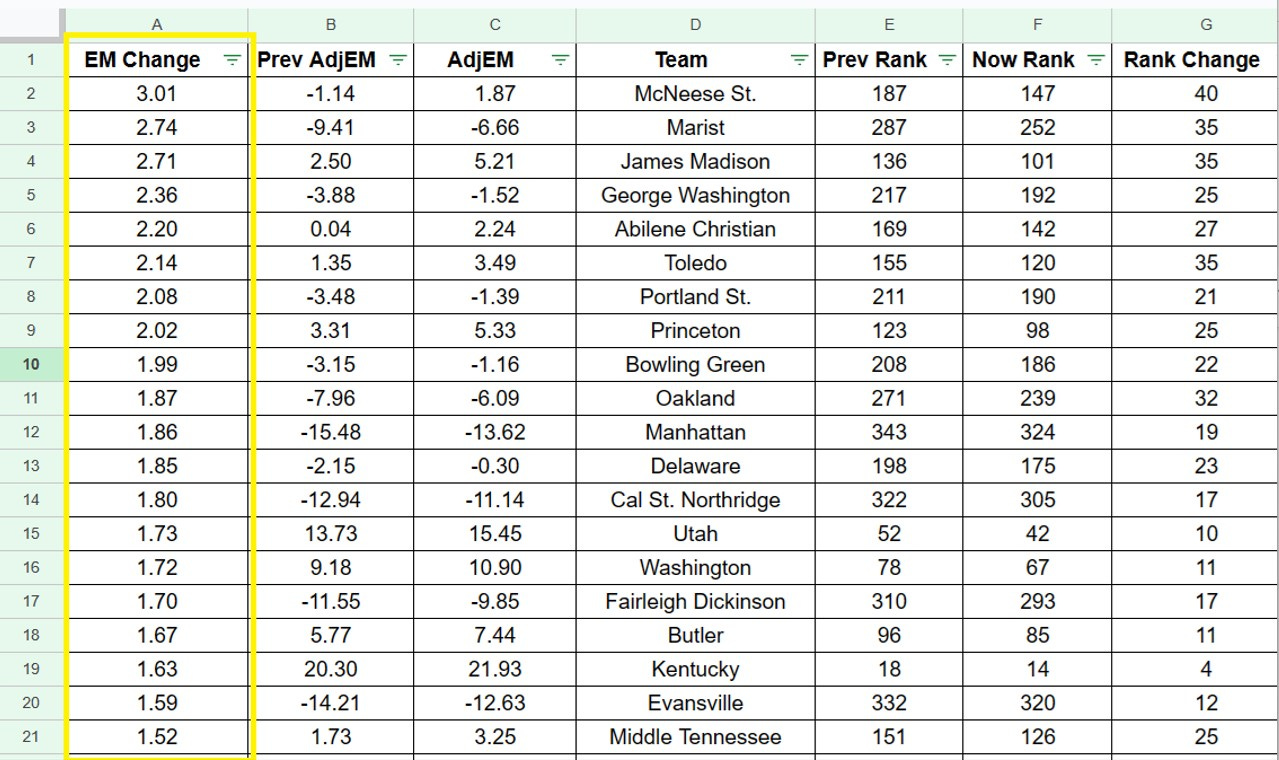
20 Biggest Gainers
20 Biggest Fallers

(Data from KenPom.com)
Nice graphics, great article.